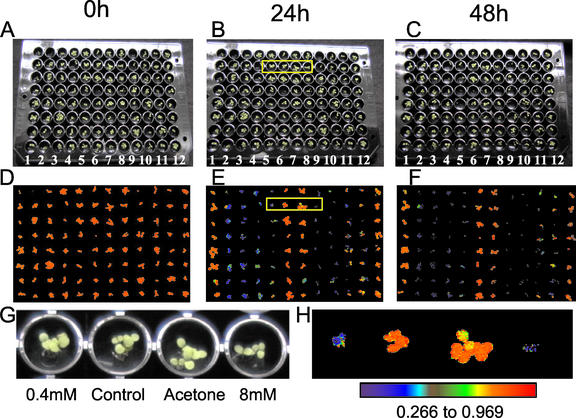
Figure 2.
Detection of the effects of the herbicide Imazapyr on plant metabolism using chlorophyll fluorescence imaging before the appearance of visual effects on plant growth. A, Four-day-old Arabidopsis plants growing in a 96-well plate immediately before treatment with 0.4 (rows 5 and 11), 0.8 (rows 4 and 10), 4 (rows 3 and 9), and 8 (rows 2 and 8) mm Imazapyr in 50% (v/v) acetone containing 0.1% (v/v) Tween; plants in rows 6 and 12 were untreated controls, and plants in rows 1 and 7 were treated with 50% (v/v) acetone containing 0.1% (v/v) Tween. Plants treated as described for A are shown after 24 and 48 h in B and C, respectively. Images of the chlorophyll fluorescence parameter, Fv/Fm, for the plants shown in A, B, and C are shown in D, E, and F, respectively. G and H, Enlargements of the plants and images of Fv/Fm outlined by the yellow boxes in B and E, respectively. The data in the images of Fv/Fm shown in D, E, F, and H respectively have been mapped to the color palette shown below H.

