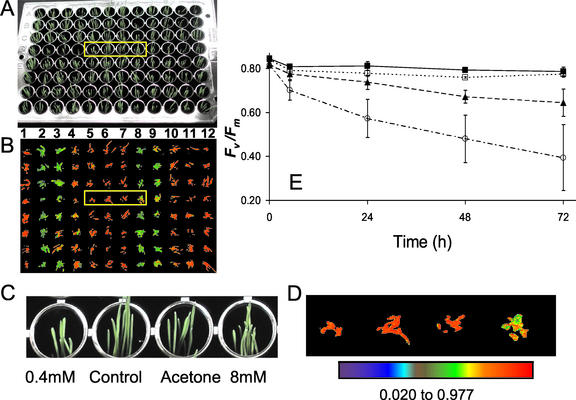
Figure 6.
Detection of the effects of the herbicide Imazapyr on plant metabolism in A. tenuis using chlorophyll fluorescence imaging. A, Four-day-old plants growing in a 96-well plate after treatment for 48 h with 0.4 (rows 5 and 11), 0.8 (rows 4 and 10), 4 (rows 3 and 9), and 8 (rows 2 and 8) mm Imazapyr in 50% (v/v) acetone containing 0.1% (v/v) Tween; plants in rows 6 and 12 were untreated controls, and plants in rows 1 and 7 had been treated with 50% (v/v) acetone containing 0.1% (v/v) Tween. Images of the chlorophyll fluorescence parameter, Fv/Fm, for the plants shown in A are shown in B. C and D, Enlargements of the plants and images of Fv/Fm outlined by the yellow boxes in A and B, respectively. The data in the images of Fv/Fm shown in B and D, respectively, have been mapped to the color palette shown below D. E, Changes in Fv/Fm with time after treatment of plants with 0.8 mm Imazapyr (▴), 8 mm Imazapyr (○), and 50% (v/v) acetone containing 0.1% (v/v) Tween (□). Untreated controls are indicated by (▪). Data are the means of eight replicates; ses are shown when larger than the symbol.

