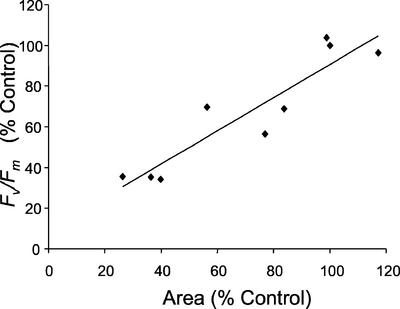
Figure 7.
The relationship between Fv/Fm and leaf area for Arabidopsis plants treated with 0.4, 0.8, and 4 mm Imazapyr for 6 and 48 h. Each point represents the mean values of eight replicates of Fv/Fm and fluorescent leaf area calculated from images of Fv/Fm (as shown in Fig. 3) and Fm. The relationship between Fv/Fm and fluorescent leaf area is given by y = 0.816x + 0.09 with R2 = 0.851.

