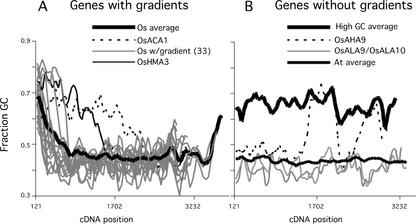
Figure 8.
GC gradient analysis reveals three Arabidopsis-like profiles in rice. GC content of DNA sequences was calculated using an in-house program called GeneGC (http://plantst.sdsc.edu/plantst/html/geneGC.shtml). The GC content was calculated in all of the full-length P-type ATPases in rice and Arabidopsis using a 121-bp sliding window that moved in steps of 51 bp. The GC content of the Arabidopsis sequences varies between 40% and 50%. The average of all the Arabidopsis genes is shown in B for comparison. All of the rice genes with 5′ gradients are shown in A. The genes in B do not have 5′ gradients and were classified as having high GC content or Arabidopsis-like “normal” GC content. Only the averages of the genes with high GC content are shown. Genes with unusual GC patterns have different markers.

