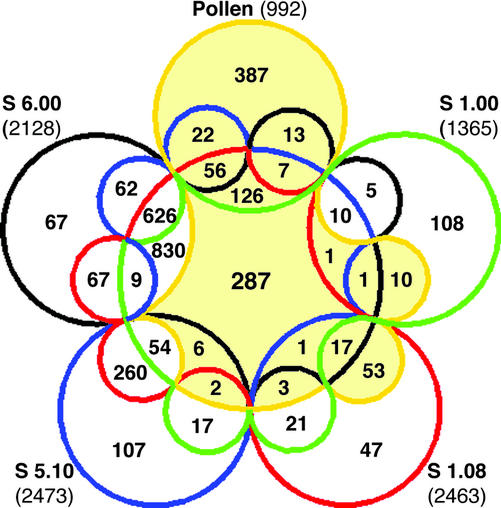
Figure 4.
Quantification of gametophytic-sporophytic and sporophytic-sporophytic overlaps of transcriptome profiles. Venn diagram illustrating all 31 possible intersections between five independent transcriptome data sets including the number of genes composing each of these overlapping categories. Transcriptome data sets were as follows: mature pollen (pollen), open cotyledon stage (S 1.00), four leaf rosette stage (S 1.08), first visible flower bud stage (S 5.10), and first open flower stage (S 6.00). Numbers in parentheses indicate the total number of genes expressed in each data set.

