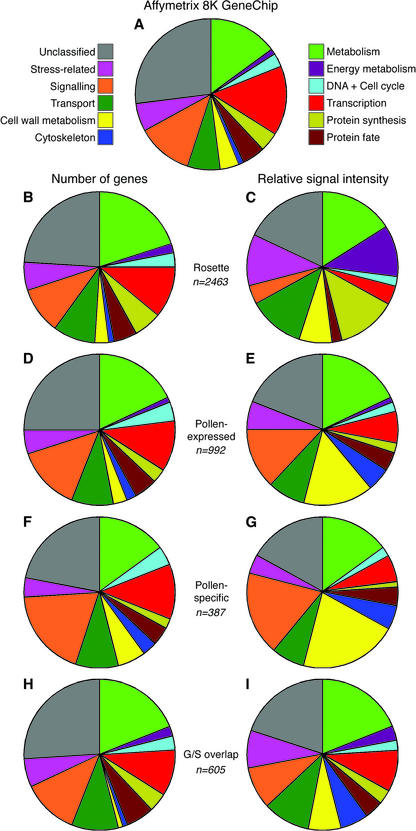
Figure 5.
Distribution of expressed mRNAs among gene function categories. Pie charts display each gene function category according to the number of expressed genes (B, D, F, and H) or their relative signal intensity (C, E, G, and I). The number of expressed mRNAs present in each data set are indicated. Percentage data for each pie are provided as supplemental information (Supplemental Fig. 1). A, Distribution of genes embedded on the 8K GeneChip among 12 functional categories. B through I, Functional distribution of mRNAs expressed at four leaf rosette stage (B and C); total pollen-expressed mRNAs (D and E); pollen-specific mRNAs (F and G); and pollen-expressed mRNAs showing gametophytic-sporophytic overlap (H and I).

