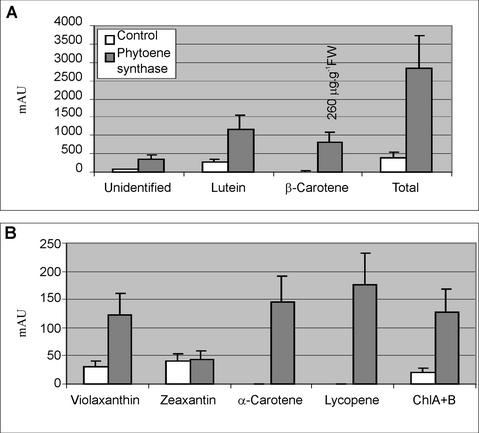
Figure 4.
Comparison of HPLC average peak areas (mAUs at 450 nm) from seed extracts of five wild-type (white bar) and five transgenic plants (gray bar). Calculated Student's t test (two-tailed equal or unequal variance, tested by F-test) significances comparing wild type to phytoene transformant peak areas: violaxanthin, P > 0.001; zeaxanthin, P > 0.1; lutein, P > 0.001; β-carotene, P > 0.001; chlorophyll A, P = 0.0017; and chlorophyll B, P > 0.001. Total peak areas, P > 0.001.

