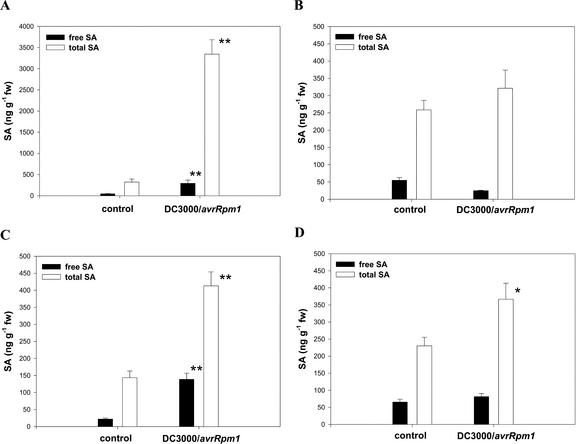
Figure 4.
Changes in SA in individual Arabidopsis rosette leaves. Free (squlf) and total (□) SA levels are shown for leaves L1 (A), L2 (B), L3 (C), and L4 (D) 48 h after treatment of L1 with either 10 mm MgSO4 (control) or 5 × 10⁷ colony forming units (cfu) mL–1 Pseudomonas syringae pv maculicola DC3000/avrRPM1. * and **, Values significantly different from the control at the P = 0.05 and 0.01 levels (Student's t test), respectively. Note the use of a different concentration scale for L1.

