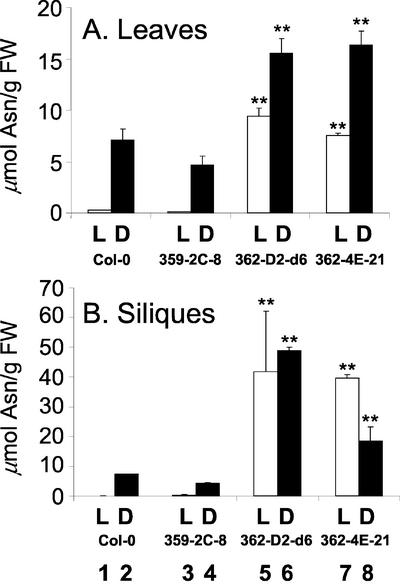
Figure 2.
Elevation of amino acid levels in 35S-ASN1 lines grown under continuous light or continuous dark treatment. A, Leaves, plants were grown under the same treatment as in Figure 1. B, Siliques, 9-d-old seedlings were transferred to soil and grown under a regular day/night cycle (as described in Fig. 1) until most of the flower buds had turned into green siliques. One-half of the plants were subject to continuous light (L; white boxes) and the remaining one-half was subject to continuous dark treatment (D; black boxes), respectively, for 48 h. Leaves and siliques were harvested, and their amino acid levels were measured using amino acid analyzers (see “Materials and Methods”). Each bar represents an average of two samples. Error bars = ses. The data were analyzed by one-way ANOVA followed by lsd (Fisher's lsd) test. **, Corresponding lines were grouped distinctly from both control lines with P values less than 0.01. FW, Fresh weight.

