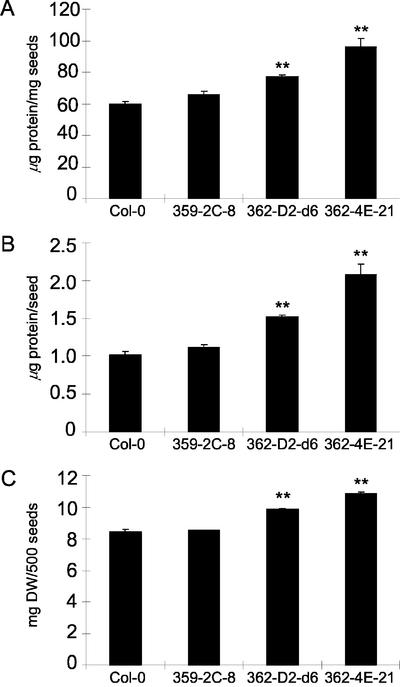
Figure 3.
Elevation of soluble protein content in seeds of 35S-ASN1 lines. Seeds were prepared, harvested, and then assayed for soluble seed protein contents and seed weight as described in “Materials and Methods.” Each data point represents an average value determined from six to eight aliquots of 500 seeds randomly sampled from two seed pools of 12 plants each for each line. Soluble seed protein contents were expressed both on per milligram seeds (A) and per seed (B) basis. Weight data for the 500-seed aliquots were also shown (C). Error bars = ses. The data were analyzed by one-way ANOVA followed by lsd test. **, Corresponding lines were grouped distinctly from both control lines with P values less than 0.01. DW, Air-dried weight.

