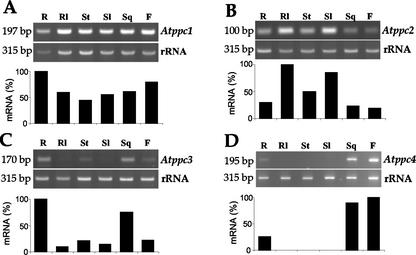
Figure 4.
Differential expression of PEPC genes in Arabidopsis. DNA-free total RNA (0.8 μg) isolated from different Arabidopsis tissues were analyzed by relative quantitative RT-PCR using gene-specific primers in the presence of 18S rRNA primers and competimers. Experiments were repeated at least three times obtaining similar results. The expected sizes of the bands corresponding to the different transcripts are: Atppc1, 197 bp; Atppc2, 100 bp; Atppc3, 170 bp; Atppc4, 195 bp and rRNA, 315 bp, as indicated on the left. Ethidium bromide-stained bands for each gene were quantified with the ScionImage software and compared with the corresponding rRNA band. The highest value in each analysis was arbitrarily considered as 100%. R, Root; Rl, rosette leaves; St, stem; Sl, stem leaves; Sq, silique; F, flower.

