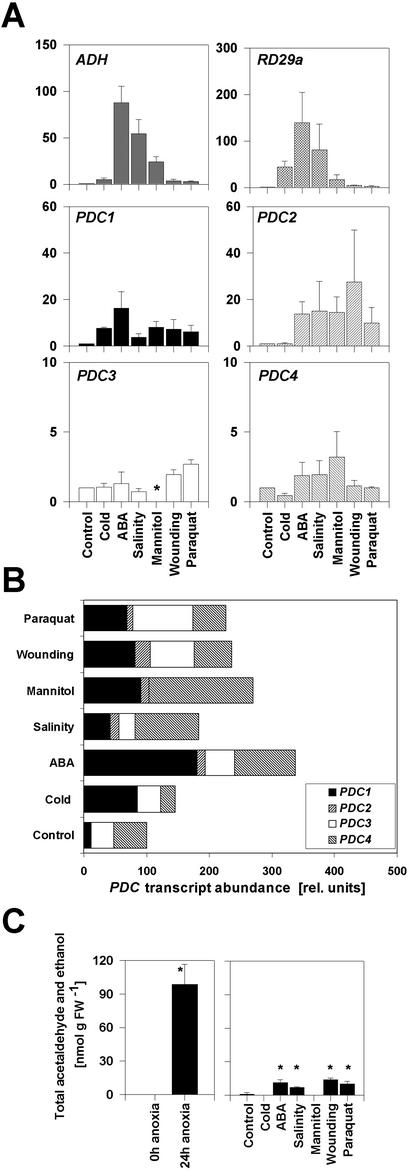
Figure 5.
Relative expression levels of fermentation genes under different abiotic stresses and total acetaldehyde and ethanol production by leaves submitted to anoxia or other stress treatments. A, Quantification of mRNA of ADH, PDC, and RD29a transcripts with the a quantitative real-time PCR system from seedlings treated with different abiotic stresses. Expression levels were normalized with respect to the internal control ACT2 and are plotted relative to the control treatment. Data bars represent the mean ± se level of transcripts from three experiments with independent RNA extractions. Asterisk indicates no detection of amplification. Note different scales as y axis. B, PDC transcript abundance in different treatments. Total PDC mRNA in control-treated seedlings = 100. Contribution from individual genes according to A is represented. C, Leaves were subjected to the indicated treatments. Measurements were made by gas chromatography. Values represent the mean ±se of between three and five measurements of different leaves. Asterisks indicate significant differences relative to the control treatment, P < 0.005).

