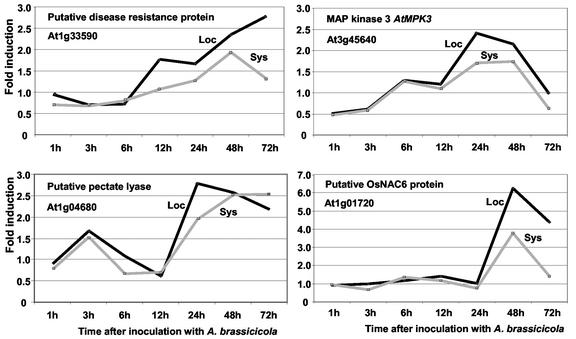
Figure 2.
Expression profiles of selected Arabidopsis genes during a time course in local (Loc) and distal (Sys) leaf tissue after inoculation with A. brassicicola. Shown are induction ratios (y axes) obtained by RT-qPCR experiments over time after inoculation (x axes). Note that the y axis scale is different for the gene encoding a putative OsNAC6 protein.

