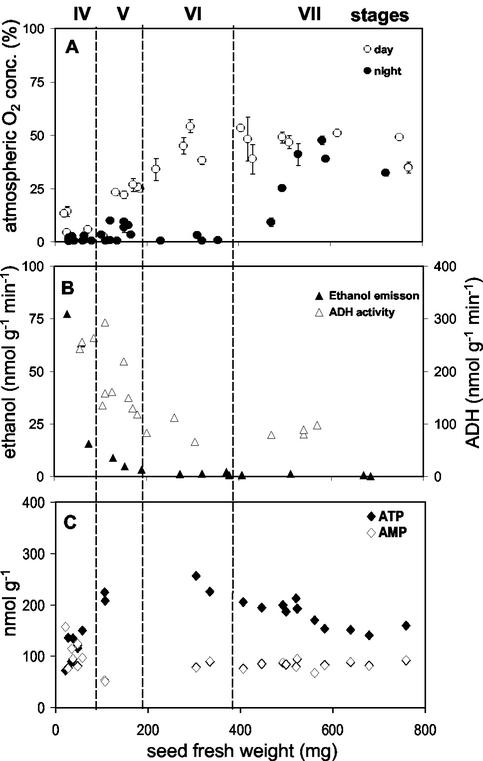
Figure 2.
A, Developmental changes in O2 levels (percentage of atmospheric O2 concentration) measured in embryos of broad bean at day and night. One data point represents six measurements within a single embryo. B, Ethanol emission rate and ADH enzyme activity. C, Levels of ATP and AMP. Staging of V. faba seed development (see Borisjuk et al., 1995).

