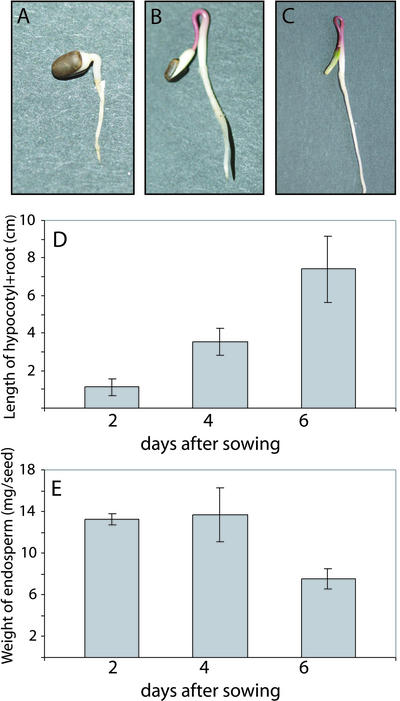
Figure 1.
Growth of E. lagascae seedlings. A, Seedling 2 d after sowing. B, Seedling 4 d after sowing. C, Seedling 6 d after sowing. D, Graph showing the length (cm) of the hypocotyl + root at 2, 4, and 6 d after sowing. E, The average weight (mg seed–1) of the endosperm in each seed. Values are the means of at least 11 independent measurements. Error bars indicate 1 sd.

