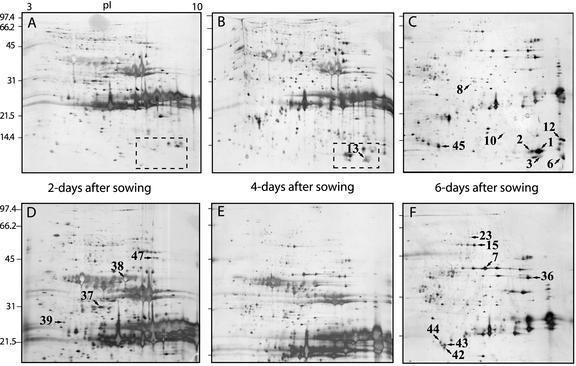
Figure 2.
Silver-stained two-dimensional gels that indicate the differences in the endosperm proteome during different stages of seed germination. Proteins were extracted from E. lagascae endosperm 2, 4, and 6 d after sowing. Gels containing 15% or 12.5% (w/v) polyacrylamide were used for second dimension electrophoresis. A, 2 d after sowing, 15% (w/v) polyacrylamide. B, 4 d after sowing, 15% (w/v) acrylamide. C, 6 d after sowing, 15% (w/v) polyacrylamide. D, 2 d after sowing, 12.5% (w/v) polyacrylamide. E, 4 d after sowing, 12.5% (w/v) polyacrylamide. F, 6 d after sowing, 12.5% (w/v) polyacrylamide. All six gels were made with the same low molecular mass protein standard having a range from approximately 97 to 14 kD. pI values indicated in gel A, ranging from 3 to 10, apply to all gels. The numbers refer to the protein spot numbers in Table I. Dashed squares in A and B indicate part of gels enhanced in Figure 3.

