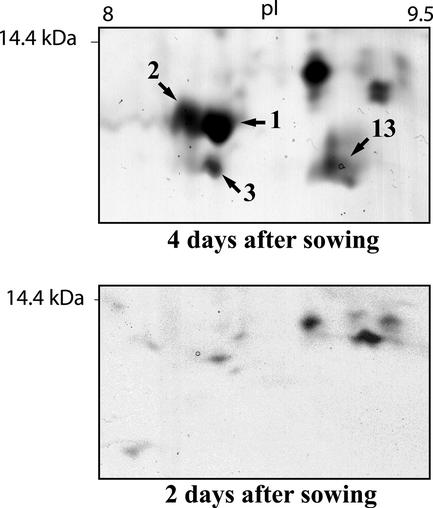
Figure 3.
Close-up of the lower right part (indicated in Fig. 2, A and B, by a dashed square) of the 2- and 4-d gels, showing the identified LTP spots in greater detail. The numbers refer to the spot numbers in Table I. The position of the 14.4-kD molecular mass marker as well as approximate pI values of 8 to 9.5 are displayed.

