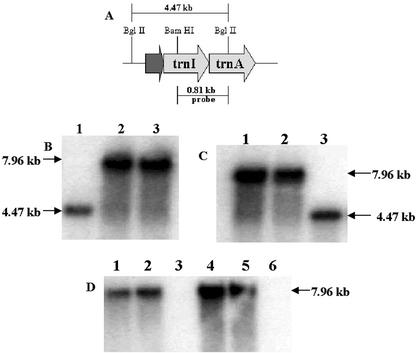
Figure 3.
Southern-blot analysis using the flanking sequence probe and the merAB probe. A, The map shows the wild-type chloroplast genome, restriction digestion sites used for Southern-blot analysis, and the 0.81-kb flanking sequence probe. B, Transgenic lines (T0 generation) for the pLDR-MerAB (lane 2) and the pLDR-MerAB-3′-UTR (lane 3) show the expected size fragment of 7.96 kb; the untransformed control (lane 1) shows the 4.47-kb fragment. C, Lanes 1 and 2, T1 generation transgenic lines; lane 3, the untransformed control. B and C, The flanking sequence probe was used. D, T0 transgenic lines, pLDR-MerAB (lane 1), pLDR-MerAB-3′-UTR (lane 2), and their respective T1 generation transgenic lines (lanes 4 and 5) show the 7.96-kb fragment. Lanes 3 and 6, Untransformed wild type. The merAB probe was used in D.

