Figure 1.
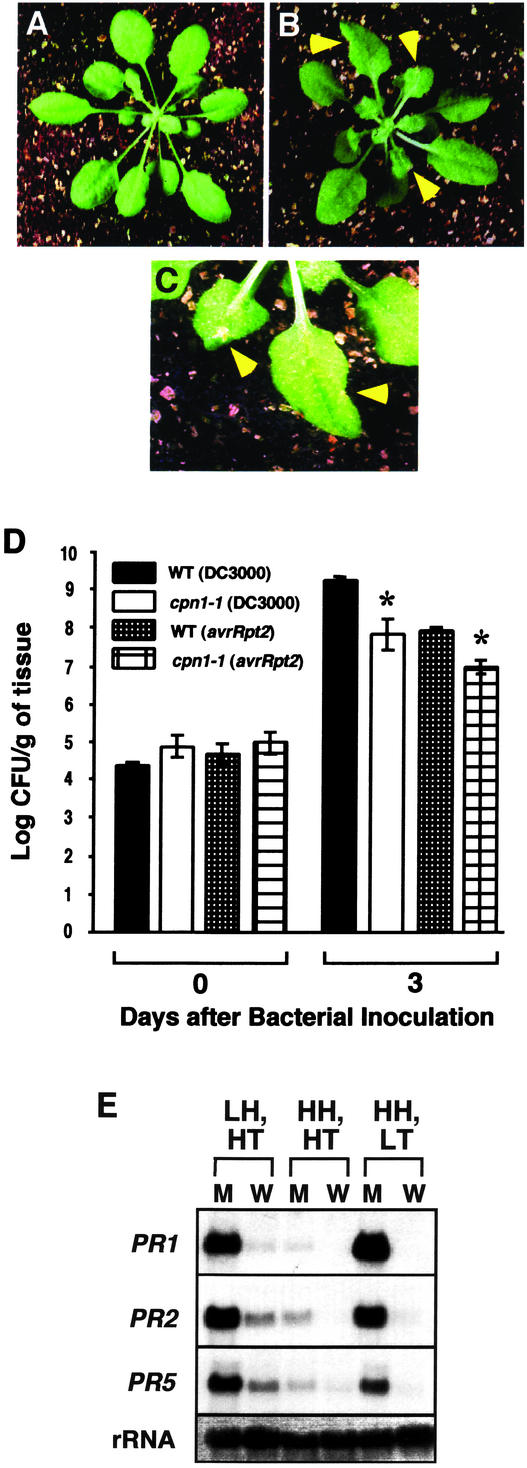
Temperature-dependent lesion mimic, increased disease resistance, and PR gene expression phenotypes of cpn1-1. A, Five-week-old WT plant grown under LT, HH, SD conditions. B, Five-week-old cpn1-1 mutant plant grown under LT, HH, SD conditions. C, Close-up view of lesions on leaves of a 5-week-old cpn1-1 mutant plant grown under LT, HH, SD conditions. Arrows in B and C indicate lesion locations. D, Growth of virulent P. s. t. DC3000 bacteria and avirulent P. s. t. DC3000 (avrRpt2) bacteria in WT and cpn1-1 plants grown under LT, HH, SD conditions. Plant leaves were infiltrated with a bacterial suspension at a concentration of 1 × 10⁵ colony forming units (cfu) mL–1. Bacterial populations were monitored on d 0 and 3 postinoculation. Bars = se. Asterisks, Significantly lower bacterial populations in cpn1-1 as compared with the corresponding WT plants according to a Student's t test (two-sample Student's t test assuming unequal variances). E, RNA gel-blot analyses of PR1, PR2, and PR5 transcript levels in cpn1-1 mutant (M) and WT (W) plants grown under three different environmental conditions: LH, HT; HH, HT; and HH, LT. rRNA, 28S rRNA stained with methylene blue to show relative amount of RNA in each lane.

