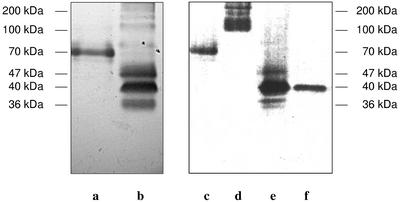
Figure 3.
Heme staining of pmPOX fractions after modified SDS-PAGE. Electrophoresis was performed using a low concentrated SDS-PAGE, i.e. 0.1% (w/v) SDS in all solutions and gels without dithiothreitol or mercaptoethanol. Thus, the oligomers were not separated into their subunits. Heme-containing protein bands were visualized by their reaction with the peroxidase substrates tetramethylbenzidine (TMB) and H2O2 as described in “Materials and Methods.” Left, pmPOX1 (a) and pmPOX2 (b) are shown after cation exchange chromatography. Further purification of these fractions by size exclusion is presented on the right: pmPOX1 (c), pmPOX2a (d), and pmPOX2b (e). In addition, f shows pmPOX2b treated with 25 mm dithiothreitol. Bars indicate the corresponding molecular masses. After size exclusion chromatography, the PM-bound enzymes had apparent molecular masses of 70 and 40 kD for pmPOX1 and pmPOX2b, whereas pmPOX2a exhibited a broad protein band between 100 and 170 kD.

