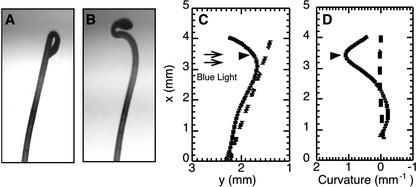
Figure 1.
Mathematical descriptions of hypocotyl shape and curvature of a representative seedling at 0 and 240 min after the start of illumination with unilateral blue light (0.1 μmol m–2 s–1). A and B, Images of hypocotyl before (A) and after (B) phototropic stimulation. C, Plot of the mathematical description of phototropism using nonlinear regression (R > 0.98) to fit 30 x/y coordinates taken from the images of the hypocotyl shown in A and B. The x/y coordinates represent pixel coordinates from the time-lapse images (the axis are reversed to simplify the calculations). D, Plot of curvature (per millimeter) along the hypocotyl. Curvature is the reciprocal of the radius of curvature. The small black arrows indicate the light direction. The black arrowheads indicate the vertex position.

