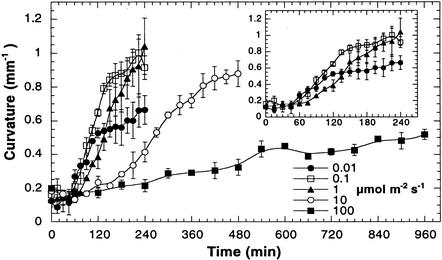
Figure 3.
Fluence rate-dependent attenuation of wild-type phototropic curvature. At fluence rates above 1 μmol m–2 s–1, the lag time required for phototropic curvature increased and the magnitude of curvature was attenuated. The inset shows the time period for the low-fluence-rate phototropic responses. Error bars represent se.

