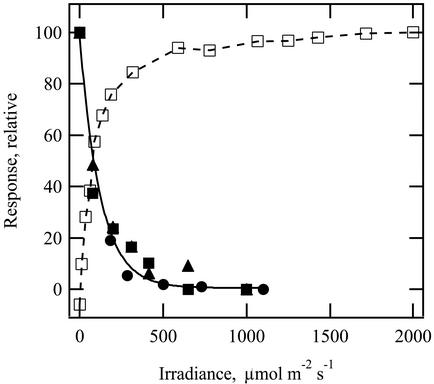
Figure 2.
Effect of varying the continuous background irradiance on amplitude of the oxygen pressure wave (black symbols with exponential fit). Black symbols are a scatter plot of three replicate experiments, all at 20°C. For each, the highest irradiance was 1,000 to 1,100 μmol m–2 s–1. White squares represent a photosynthetic light curve for CO2 assimilation obtained at 20°C to 22°C using conventional gas exchange techniques. Ambient CO2 concentration was 375 ± 3 μL L–1. Data are normalized for comparison.

