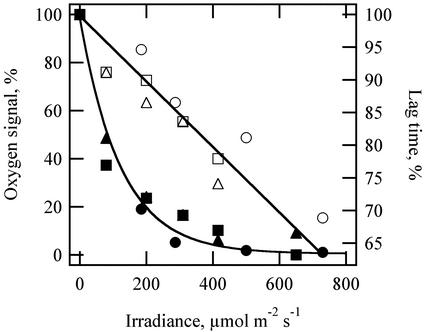
Figure 7.
Effect of background light intensity on amplitude and lag time for the photoacoustic oxygen signal. Amplitudes for the oxygen signal are from Figure 2 (black symbols). Lag times between the thermal signal and the oxygen signal for the same three replicate experiments are also shown (white symbols). Data are normalized for comparison; maximum lag times varied between 7.1 and 8.4 ms for these experiments.

