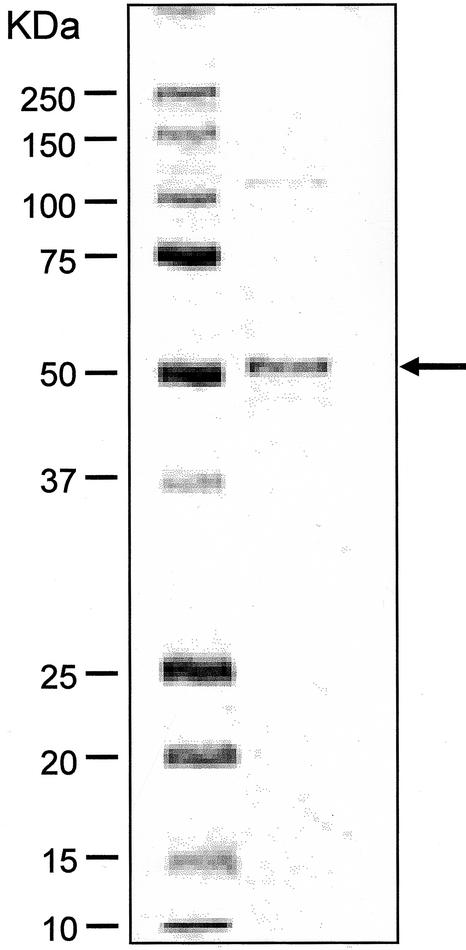
Figure 6.
SDS-PAGE analysis of the 3′GT protein expressed in E. coli. The active fraction after a Phenyl Sepharose column was analyzed through a 10% to 20% (m/v) polyacrylamide gel and stained by Coomassie Blue. Left lane, Mr marker; right lane, the active fraction after a Phenyl Sepharose. Mr for each band of the marker is indicated to the left of the panel. The arrow indicates the size for 3′GT.

