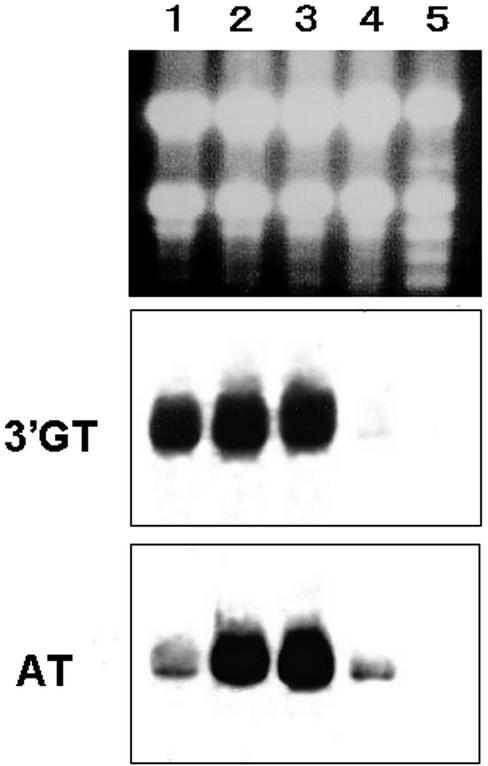
Figure 8.
Northern-blot analysis of the expression of the gentian 3′GT gene. Ten micrograms of total RNA from gentian petals at each developmental stage and from leaves was loaded on each lane and probed with DIG-labeled gentian 3′GT cDNA (middle panel) or gentian 5AT cDNA (bottom panel; Fujiwara et al., 1998) after electrophoresis and transfer to nylon membrane. The top panel shows RNA samples on an agarose gel before transfer to a nylon membrane. RNA was from petals of unpigmented buds tightly closed (lane 1), petals of pigmenting buds (lane 2), petals of fully pigmented buds before opening (lane 3), petals of fully opened flowers (lane 4), and leaves (lane 5).

