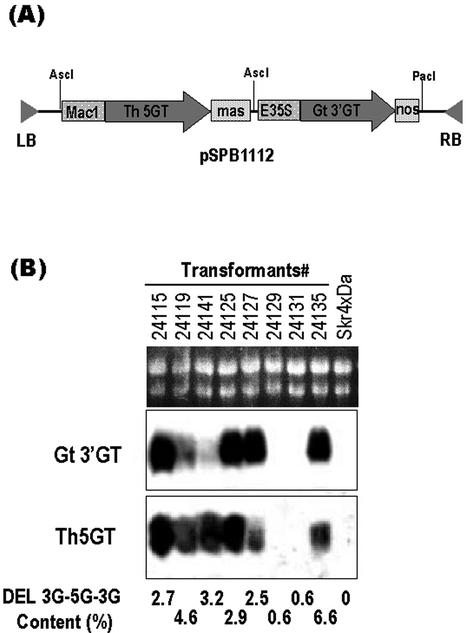
Figure 9.
Northern-blot analysis of the expression of gentian 3′GT and torenia 5GT transgenes in petunia transformants. A, Schematic view of the binary plasmid pSPB1112 expression cassettes for both gentian 3′GT and torenia 5GT cDNAs. B, Ten micrograms of total RNA from petals of each transformant and host petunia cv Skr4 × Da was loaded on each lane, and the membrane was probed with 32P-labeled gentian 3′GT cDNA (middle panel) and torenia 5GT cDNA (bottom panel). The top panel shows RNA samples on an agarose gel before transfer to a nylon membrane. The numbers above the panel identify each transformant. The content of DEL 3G-5G-3′G in fully opened flowers of each transformant (as a percentage of total anthocyanins analyzed by HPLC) are described below the bottom panel.

