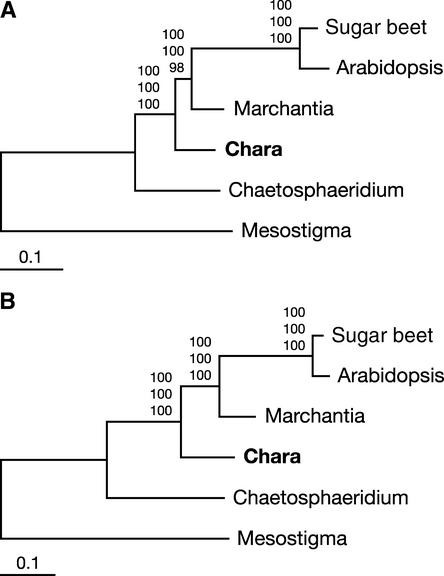
Figure 3.
Phylogenetic Position of Chara as Inferred from Complete Mitochondrial Genome Sequences of Green Plants.
(A) Phylogenetic analysis of a concatenated data set of 23 mitochondrial proteins. The best maximum likelihood tree computed with CODEML using a Γ-distributed rate of substitutions across sites is shown. Bootstrap values obtained in maximum likelihood, distance, and maximum parsimony analyses are indicated above the nodes in the top, middle, and bottom positions, respectively. Bootstrapping in both the maximum likelihood and distance analyses was performed using a Γ-distributed rate of substitutions across sites.
(B) Phylogenetic analysis of a concatenated data set of 23 genes. This nucleotide data set corresponds to the protein data set. The best maximum likelihood tree is shown. Bootstrap values obtained in maximum likelihood, distance, and maximum parsimony analyses are indicated above the nodes in the top, middle, and bottom positions, respectively.

