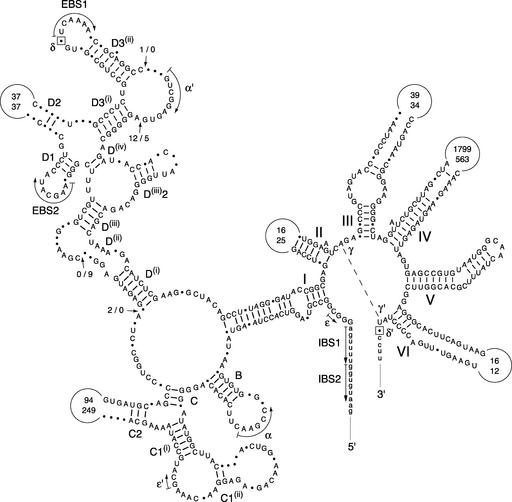
Figure 8.
Compared Secondary Structure Models of the Chara and Marchantia nad3 Introns.
Exon sequences are shown in lowercase letters. Roman numerals specify the major structural domains of the introns, and uppercase letters followed by numbers denote the helices in domain I. Dashed lines, curved arrows, and/or Greek letters represent tertiary interactions. EBS and IBS indicate exon binding and intron binding sites, respectively. Nucleotides that potentially participate in the δ–δ′ interaction are boxed. Positions exhibiting different nucleotides are denoted by dots. Positions showing deletions/additions are denoted by arrows labeled with two numbers separated by a dash; the first number indicates the number of nucleotides inserted in the Chara sequence. Conserved base pairings are represented by dashes. The numbers inside the variable loops indicate the sizes of these loops in the compared introns, with the top number denoting the size of the Chara sequence.

