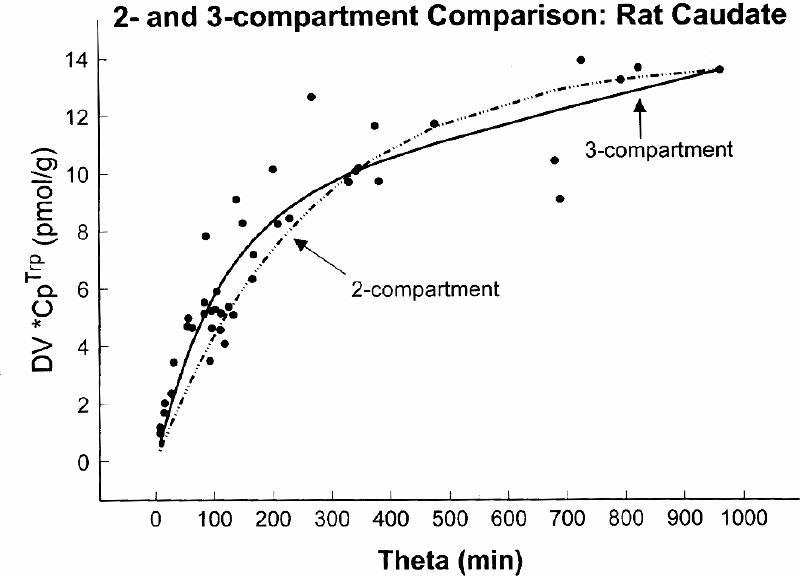
Fig. 2: A comparison between 2- and 3-compartment fits to the experimental data obtained in rats. The rats, each represented by one point on the graph, were killed at different times after tracer injection. The y axis represents distribution volume of the tracer (DV, in mL/g) obtained by dividing tissue tracer radioactivity with the plasma radioactivity measured at the end of experiment, and the x axis (theta, min) represents an integral of the plasma radioactivity divided with the plasma radioactivity at the end of experiment. A statistical evaluation of residues indicated that the 3-compartment model provided a significantly (F = 26, p < 10–4) better fit to the experimental data than the 2-compartment model.
