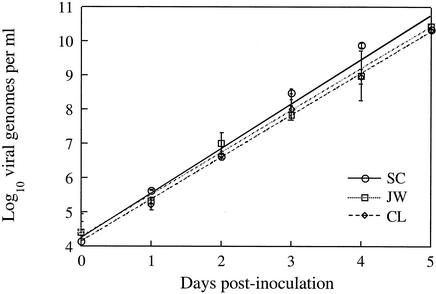
FIG. 2.
Rates of viral production for three LMBV isolates inoculated at multiplicities of infection of 1.0 onto monolayers of FHM cells, measured using real-time qPCR. Points represent average values across three replicate flasks inoculated with each isolate. Vertical bars represent standard errors of the means. Lines were fitted by the least-squares method and have statistically indistinguishable slopes and intercepts.

