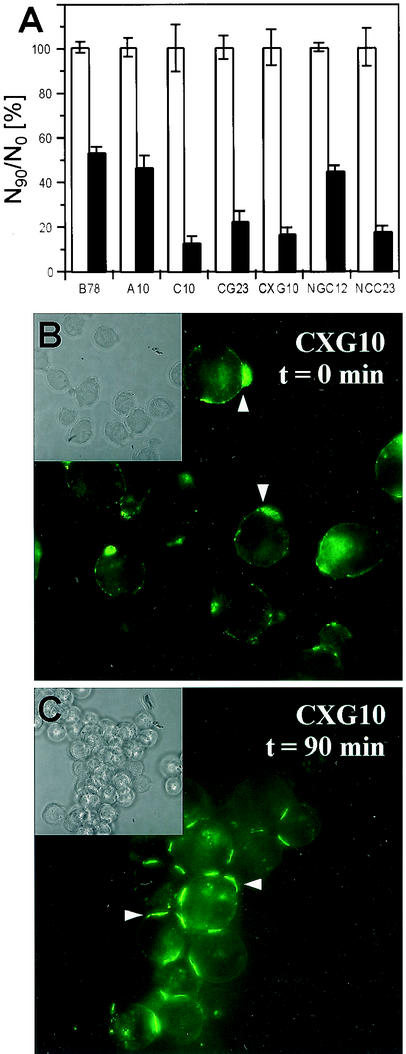
FIG. 3.
Cell aggregation mediated by nectin-1 and nectin-1-GFP. Various cell lines were trypsinized and resuspended in Hanks' balanced salt solution as a single-cell suspension. Trypsin treatment did not affect the detection of the nectin-1 ectodomain by fluorescence-activated cell sorter analysis (data not shown). Cells were then incubated at 37°C for 90 min or fixed immediately with glutaraldehyde (A) or paraformaldehyde (B and C). (A) Quantitative evaluation of nectin-1-mediated cell aggregation. Cells were observed under a microscope and scored as (N90/N0) × 100, where N90 and N0 are the total number of entities (clumps or single cells) observed at t = 90 and 0 min, respectively. Values are the mean and standard deviation of a triplicate representative experiment. A value of 100 indicates no aggregation; the lower the value, the greater the aggregation. White bars represent data at t = 0 min standardized to 100% for each cell line, and black bars represent data after a 90-min incubation. (B and C) CXG10 cells fixed after 0 min (B) or 90 min (C) of incubation at 37°C were observed for nectin-1-GFP localization as detected by green fluorescence emission. Insets show the same field as a phase-contrast image.

