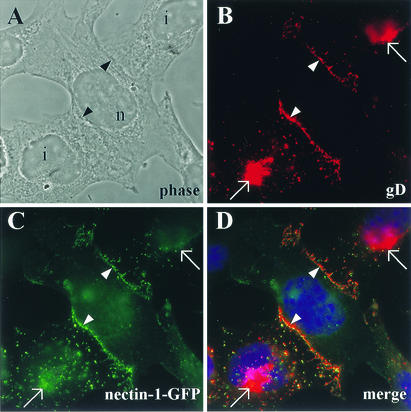
FIG. 8.
Colocalization of gD and nectin-1 between infected and noninfected cells. (A) Phase-contrast image from the observed field is shown to delineate cell morphology. i, infected cell; n, noninfected cell. (B) Nectin-1-GFP-expressing cells (CXG10) were infected at high MOI with HSV KOS tk12. Cells were fixed at 4 h p.i., permeabilized, and stained for gD expression. (C and D) Expression of nectin-1-GFP (C) and a merge picture where the yellow color indicates colocalization of nectin-1 and gD (D). Nuclei appear blue after DAPI staining (D). Arrows point to gD expressed in the Golgi system, and arrowheads indicate cell junctions.

