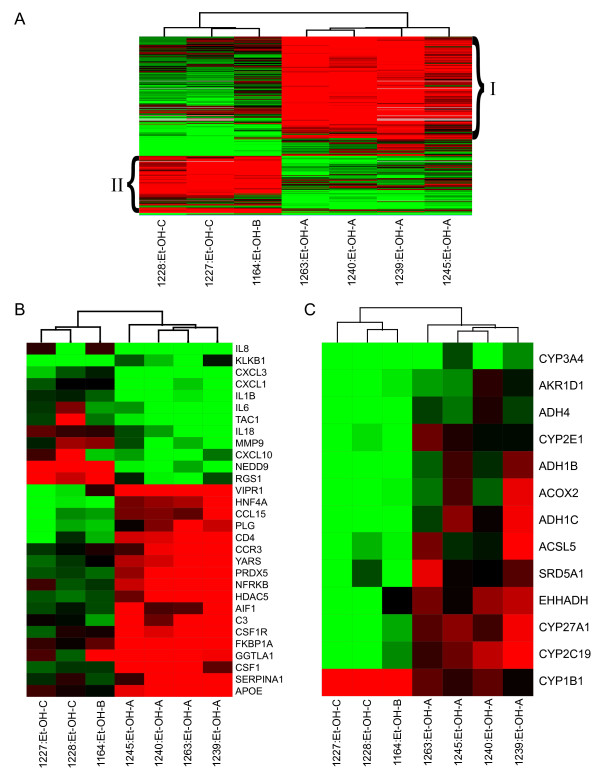
Figure 3.
Differences in global gene expression profiles between different CTP classes of ethanol-associated cirrhotic liver tissue. A. Expression profiles of genes differentially expressed in ethanol-related cirrhosis CTP class A versus CTP BC (identified from one-way ANOVA). Each column represents gene expression data from an individual experiment comparing cirrhotic and normal liver and the cluster represents genes that showed a >2-fold change (P value < 0.05) in at least 3 of 7 experiments. See legend of Fig. 1 for details on clustering, the applied color scheme for the fold changes in the mRNA levels, and experiment representation. Grouping (I and II) is discussed in the text and demonstrates differences between CTP classes in gene expression associated with various biological processes. Refer to Supplementary Table 2 for gene names in each group. B. Expression of genes associated with the inflammatory response. Cluster depicts expression of genes that were at least 2-fold regulated with a P value ≤ 0.05 in at least 3 of 7 experiments comparing cirrhotic tissue to a normal liver reference. See legend of Fig. 1 for details on clustering, the applied color scheme for the fold changes in the mRNA levels, and experiment representation C. Expression of genes involved in fatty acid and bile acid metabolism. Expression of genes that were at least 2-fold regulated with a P value ≤ 0.05 in at least 3 of 15 experiments comparing cirrhotic tissue to a normal liver reference. See legend of Fig. 1 for details on clustering, the applied color scheme for the fold changes in the mRNA levels, and experiment representation.

