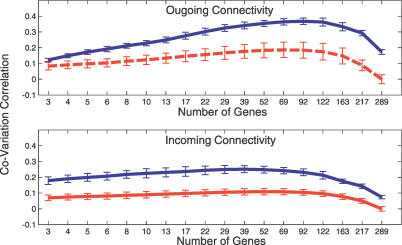
Figure 2. Covariation Correlation Feature Selection Assay.
The mean and standard deviation of the Pearson correlation (blue line) between the neurons' neighborhood relations in the expression and connectivity spaces is displayed as a function of the number of genes used to determine the expression signature (results of ten repetitions of the assay each with 90% of the neurons). The top panel shows the outgoing connectivity results, and the lower panel shows the incoming connectivity results. The rightmost point (289 genes) denotes the correlation before any feature selection is applied to the data. The dashed red line represents the empirical null hypothesis distribution of the covariation correlation on random data (constructed by shuffling 1,000 times the identities of the neurons and reapplying the analysis to the shuffled data). Maximum correlation measurements are achieved with 39 and 92 features in the incoming and outgoing assays, respectively, with corresponding p-values of p < 0.0001, p = 0.004, respectively (see Materials and Methods).

