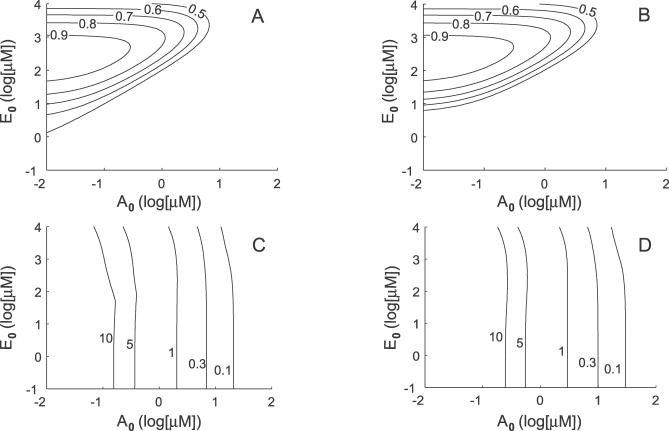
Figure 8. Comparison of the Numerically Computed and Analytically Estimated Cycling Characteristics.
The activity (upper row) and the recovery time (bottom row) profiles of GTPase are plotted versus the total concentrations of GEF and GAP. Results shown in (A) and (C) were numerically simulated using the complete model, while those shown in (B) and (D) were calculated based on the analytical estimates derived from the reduced model. Note the good match between the simulated and analytically estimated results in a broad domain of parameter values.

