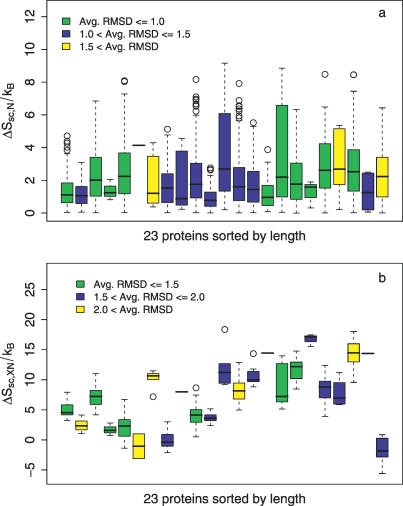
Figure 3. SCE of NMR and X-Ray Structures.
(A) Box plot for distributions of the absolute pairwise SCE difference (|ΔSN|) of NMR structures of 23 proteins. Different coloured boxes indicate different ranges of average RMSDs of the structure pairs.
(B) Box plot for distributions of the SCE difference between X-ray and NMR structures (ΔSXN) for 23 proteins. Different colours indicate different ranges of average RMSDs of the X-ray and NMR structure pairs. For proteins 1btv, 1vre, and 1ah2, α = 0.7 was used for both X-ray and NMR structures.

