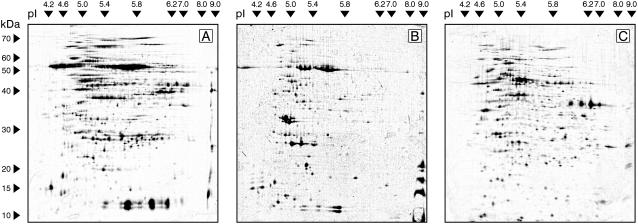
Figure 1.
Representative 2DE gels visualizing proteins from three subcellular fractions extracted from Arabidopsis leaf tissue after challenge with DC3000 hrpA (3-hpi time point displayed). The first dimension was focused across a 3 to 9 pH unit range and the second electrophoretic dimension resolved proteins between 10 and 70 kD. A, Soluble fraction. B, Chloroplast-enriched fraction. C, Mitochondria-enriched fraction.

