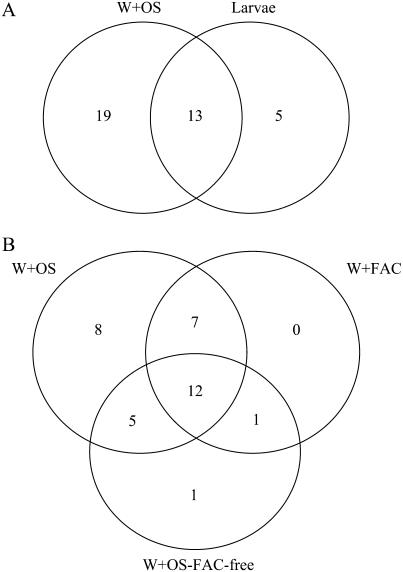
Figure 3.
Comparison of protein accumulation patterns in N. attenuata leaves among different inducers. The Venn diagram presents the number of protein spots that exhibit differential accumulation patterns among different elicitor treatments compared to control leaves. Shown are a comparison between larvae- and W + OS-induced leaves (A) and a comparison among the W + OS, W + FACs, and W + OS-FAC-free leaves (B). The numbers in circles indicate the protein spots having differential accumulation and the numbers in the common area represent protein spots with similar patterns of accumulation.

