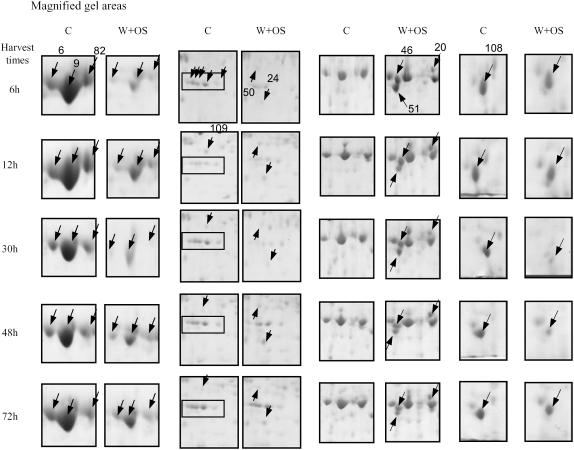
Figure 4.
Magnified areas of two-dimensional gels. The four sections show magnified areas of control and W + OS-elicited leaves at different times after elicitation (6–72 h). The boxes in the gel area (column 2) encompass spots 74, 75, 77, 78, and 80 (left to right). Numbers of protein spots with arrows are indicated in the first gel of their appearance, whereas only the positions of protein spots are shown with arrows in subsequent gels. Proteins eluted from these spots were identified by MALDI-TOF and/or LC-MS/MS (see Table I).

