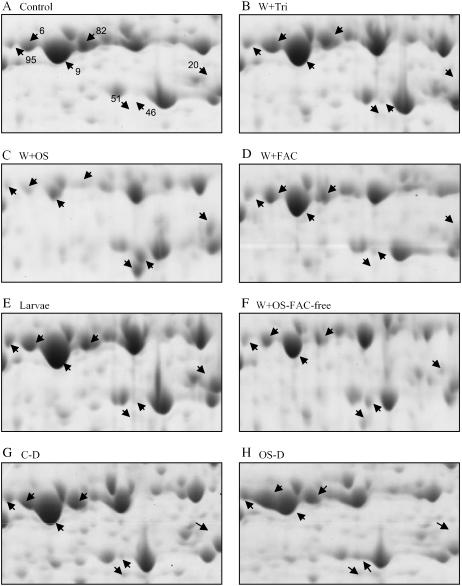
Figure 5.
Magnified areas [see areas (a) and (b) in Supplemental Figure S4] of two-dimensional gels of protein extracts from control and elicited plants from treated and distal leaves for RCA spots. Leaf protein profiles of control (A) and punctured leaves treated with 0.0025% Triton X-100 (W + Tri; B), solutions of M. sexta OS (W + OS; C), chemically synthesized FACs (W + FAC; D), feeding M. sexta larva (E), OS without FACs (W+OS-FAC-free; F), a control of distal leaves (C-D; G) and W + OS of distal leaves (OS-D; H) are shown. Leaves were collected 30 h after the application of elicitor solution and 48 h after the release of larvae on local leaves. The accumulation patterns of RCA spots were compared among these treatments.

