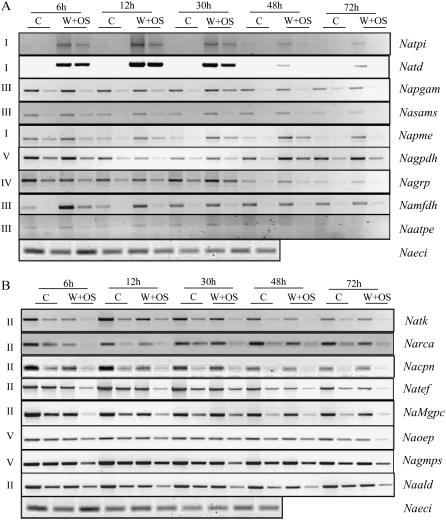
Figure 7.
Gene expression analysis of candidate proteins exhibiting differential accumulation in control and OS-induced N. attenuata leaves at different times after elicitation. Quantitative RT-PCR analysis of candidate genes in control leaves (C) and OS-induced leaves (W + OS) that show up-regulation (A; nine genes) and down-regulation (B; eight genes) between 6 and 72 h is shown. PCR reactions were carried out with two concentrations of cDNA for all primers, in at least three replicates. A single concentration of cDNA was used for ECI primers to determine the equal amount of the cDNA. The gene names, accession numbers, primer sequences, sizes of amplified cDNA fragments, and respective peptide sequence maps on proteins are provided in Supplemental Table S1 and Supplemental Figure S5.

