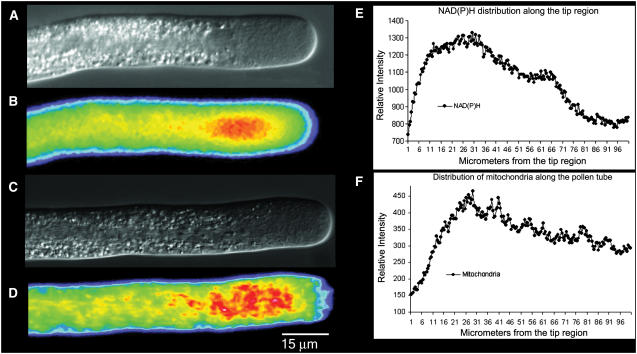
Figure 1.
A and B, From the same pollen tube, the cell structure by DIC (A) and the distribution of NAD(P)H determined by its autofluorescence (B). Note the strongest signal at a region 20 to 40 μm back from the apex. C and D, From another pollen tube, the DIC (C) image and the corresponding fluorescent image (D) revealing the distribution of mitochondria when stained with Mitotracker Green. Note the accumulation of mitochondria in the subapical region, 20 to 40 μm back from the apex. In both B and D, the color follows convention, with red indicating high and blue indicating low levels of fluorescent signal. In E and F, a line scan along the length of the pollen tubes shown in B and D plots the distribution of NAD(P)H and mitochondria, respectively. Again, note the higher signal in the subapical region.

