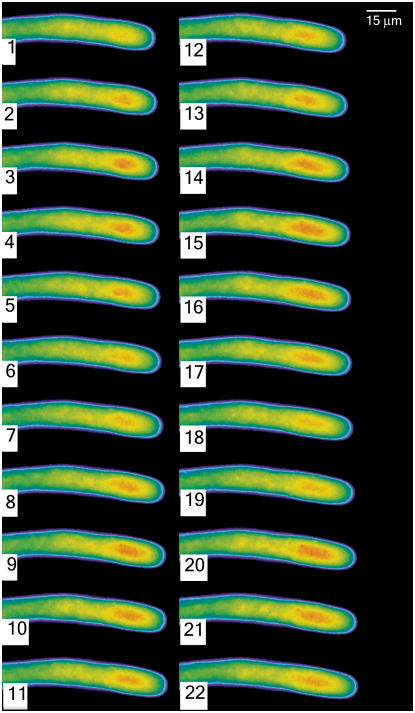
Figure 2.
A time lapse sequence of a growing pollen tube reveals the changes in NAD(P)H fluorescence as the pollen tube grows. The individual images were acquired by exposure for 250 ms, with a 3-s interval between successive images. They are displayed in pseudocolor where red indicates high levels of NAD(P)H.

