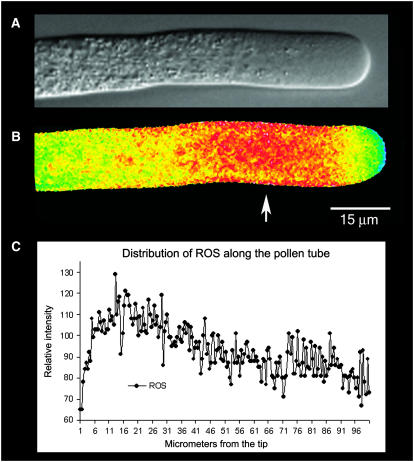
Figure 6.
A and B show the same pollen tube. A, DIC image; B, fluorescence image indicating the relative distribution of ROS. To make this image, the pollen tube was microinjected with CM-H2DCFDA, which is sensitive to ROS, and tetramethyl-rhodamine 70 kD, which is an accessible volume marker. A ratio-image of the two fluorophores provides an indication of the distribution of ROS, which is independent of the optical path length. Note the highest values in the subapical region where mitochondria are more abundant (Fig. 1D). Figure 6C provides a line scan of intensity values along the length of the pollen tube shown in B. Note the increase in signal in the subapical region (see arrow).

