Figure 1.
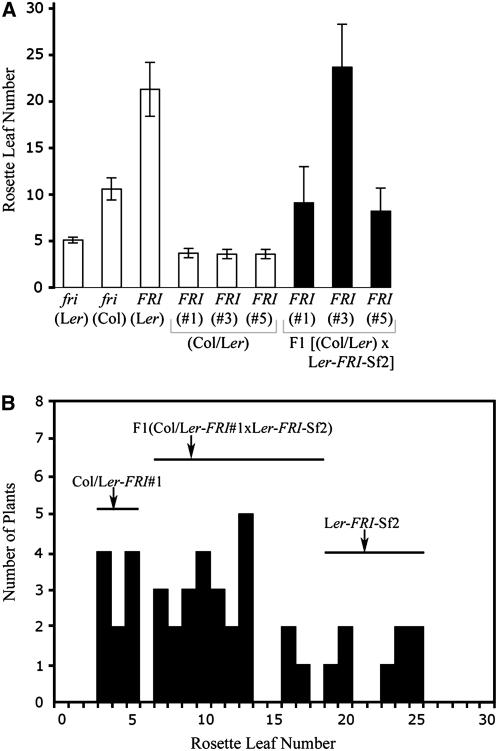
Genetic analysis of very early flowering F2 plants Col/Ler-FRI-Sf2#1, #3, and #5 from the cross of Ler-FRI-Sf2 × Col-FRI-Sf2. Flowering time is expressed as the RLN at the time of bolting. Plants were grown in long-day photoperiods. Error bars indicate two sds. A, Flowering time of F1 plants (black bars) from the cross of Col/Ler-FRI-Sf2#1, #3, and #5 with late-flowering Ler-FRI-Sf2. Flowering time of Ler and Col is presented for comparison. B, Frequency distribution of flowering time (RLN) for an F2 population from the cross of Col/Ler-FRI-Sf2#1 × Ler-FRI-Sf2. Flowering time ranges and means of parent plants and F1 hybrids are shown by horizontal lines and arrows, respectively.

