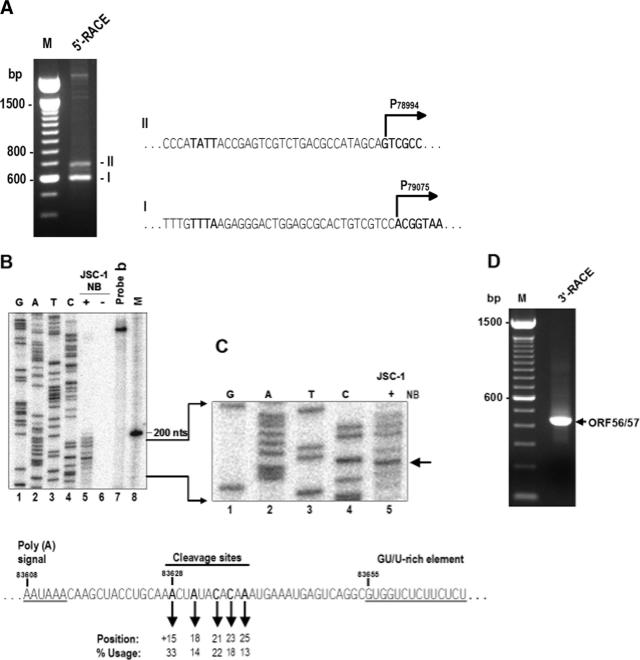
FIG. 3.
Mapping of the ORF56 transcription start site and cleavage sites for ORF56 and ORF57 polyadenylation. (A) Mapping of the ORF56 transcription start site. The 5′-RACE was conducted on total poly(A)+ mRNA isolated from butyrate-induced JSC-1 cells using an ORF56-specific primer, Pr79608. The sequences of RACE products I and II are shown to the right of the gel, where the start sites are indicated. (B) An RNase protection assay was performed on 20 μg of total RNA from uninduced or butyrate-induced JSC-1 cells with 4 ng of 32P-labeled antisense RNA probe b (see Fig. 1A) covering KSHV genome nt 83438 to 83705. The same PCR product was also cloned into the pCR2.1 vector (Invitrogen) and served as a template for sequencing with the 32P-labeled Pr83438 primer. The protected products were separated along with sequencing ladders and a 100-bp DNA ladder on an 8% denaturing polyacrylamide gel. (C) A portion of the gel in panel B, enlarged to show the protected products and the sequencing ladders. The arrow indicates a major protected product from butyrate-induced JSC-1 cells. The diagram shown below B and C contains the calculations of alternative cleavage site usage; regulatory elements upstream [a poly(A) signal] or downstream (a GU/U-rich element) of the cleavage site are also shown. (D) Mapping of ORF56/57 cleavage sites by 3′-RACE by using a primer, Pr83254 (see its position in Fig. 1A). An RACE product with the predicted size of ∼390 bp was detected, cloned, and sequenced.

