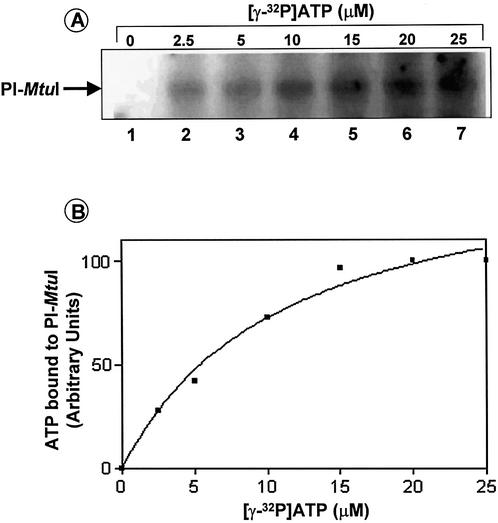
Figure 2.
Binding of 32P-labeled ATP to PI-MtuI as a function of ATP concentration. Reactions were performed with increasing concentrations of ATP as indicated above each lane. Reactions mixtures were analyzed as described in Materials and Methods. (A) Autoradiogram showing crosslinking of ATP to PI-MtuI. (B) Quantification of the extent of binding of labeled ATP. The intensity of bands was quantified after correcting the background using UVI-BandMap software ver. 99 and plotted against concentration of ATP using Graphpad Prism ver. 2.0. The graph shows the average of two independent experiments.

