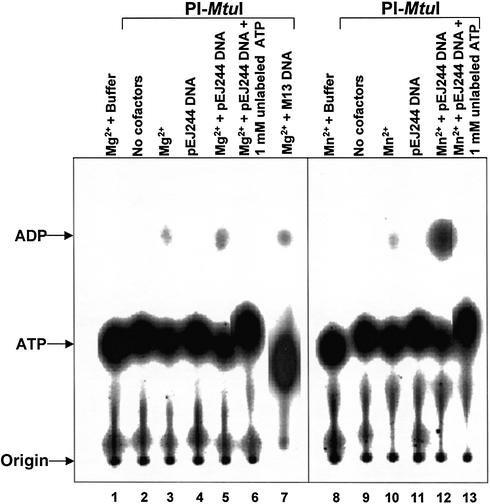
Figure 3.
ATP hydrolysis catalyzed by PI-MtuI. Reactions were performed in the absence or presence of cofactors and/or DNA as described in Materials and Methods. An autoradiogram of a typical TLC analysis showing ADP generated during the reaction in the absence (lanes 2 and 9) or presence (lanes 1, 3–8 and 10–13) of different cofactors as indicated above each lane. The positions of ATP and ADP are shown on the left.

