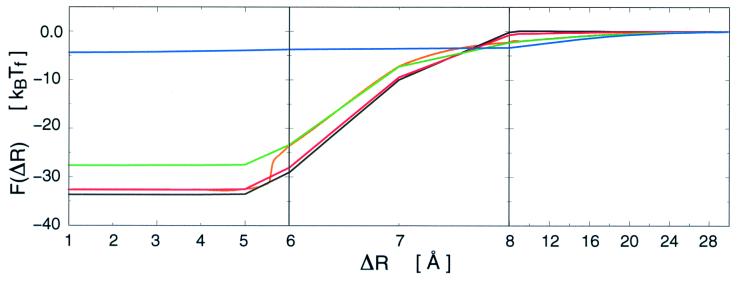
Figure 2.
Free energy of binding for specific ensembles of arc repressor. The F(ΔR) curves are shown for the folded (red) and unfolded (green) minima as well as the fully ordered [(Q = 1 (black)] and disordered [Q = 0 (blue)] states at Tf. ΔR = R − R0 is the separation distance relative to that of the bound complex (R0). The effective capture radius is expanded by 8 Å for the unfolded state over the folded (which is 16 Å) and by 14 Å over that for the completely folded Q = 1 state. The orange curve is the free energy of the steepest descent path on the F(ΔR, Qp) surface shown in Fig. 3. Note the broken scales of R used to delineate the folding events, which occur in a narrow range of approach distance. The radius of the square well potential is b = R0 + 6.5 Å. The Debye–Waller factor for the folded residues is Δf = 1 Å, and for the unfolded chain Δu = 17 Å, which is the end-to-end distance of a random coil with 20 bond segments (the number of residues in the binding site).

